- Real-Time Graphics |
- Rendering |
- Animation |
- Geometric Modeling |
- Scientific Visualization |
- Software System

- Computing Local Signed Distance Fields for Large Polygonal Models

- Cosmological Reionization after a Massive Starburst

- Visualization of Very Large Oceanography Time-Varying Volume Datasets

- Interactive Stereoscopic Visualization of Very Large Visible Men on CAVE

- Visualization-Specific Compression of Large Volume Data

- Parallel Ray Casting of Visible Human on Distributed Memory Architectures

- Wavelet-Based 3D Compression Scheme for Interactive Visualization of Very Large Volume Data
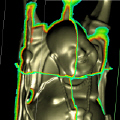
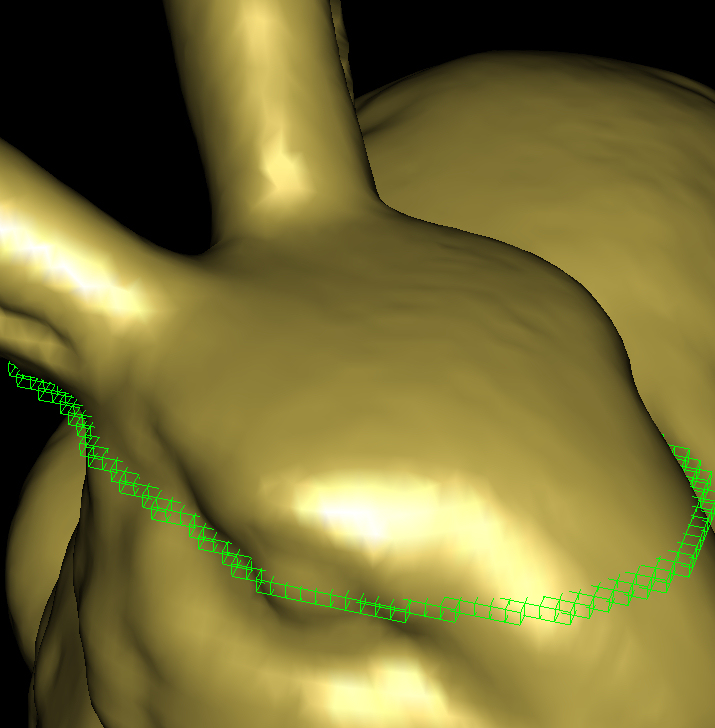
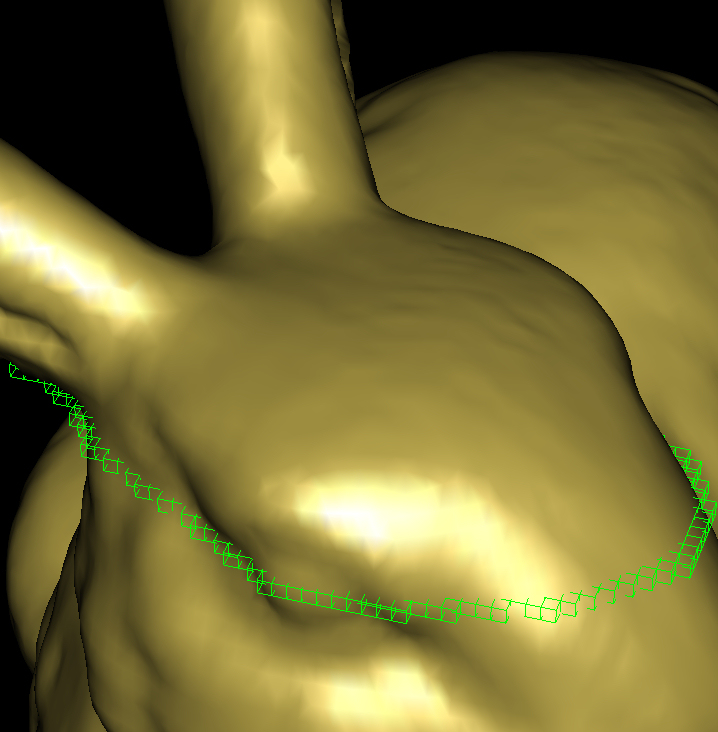
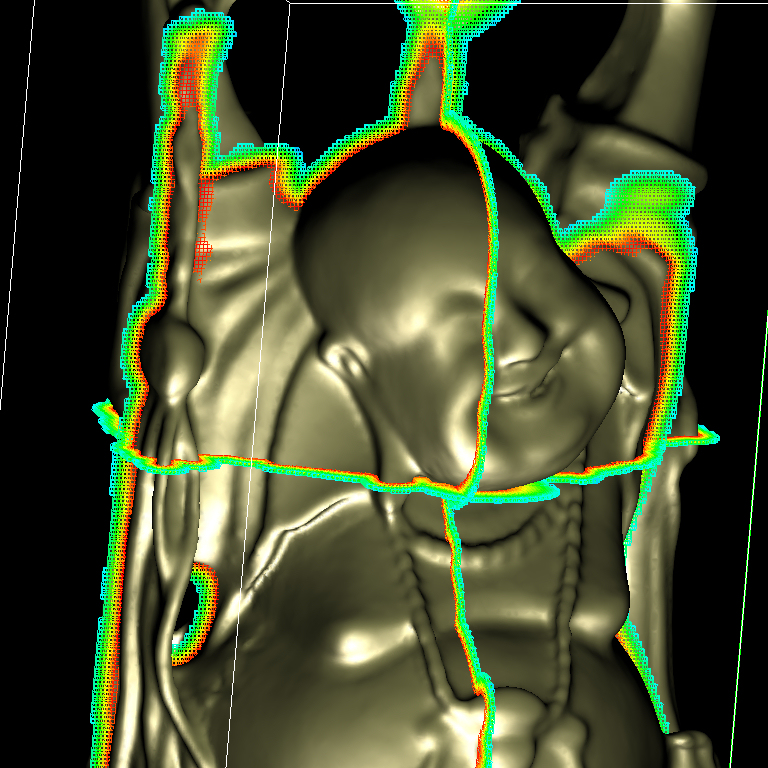
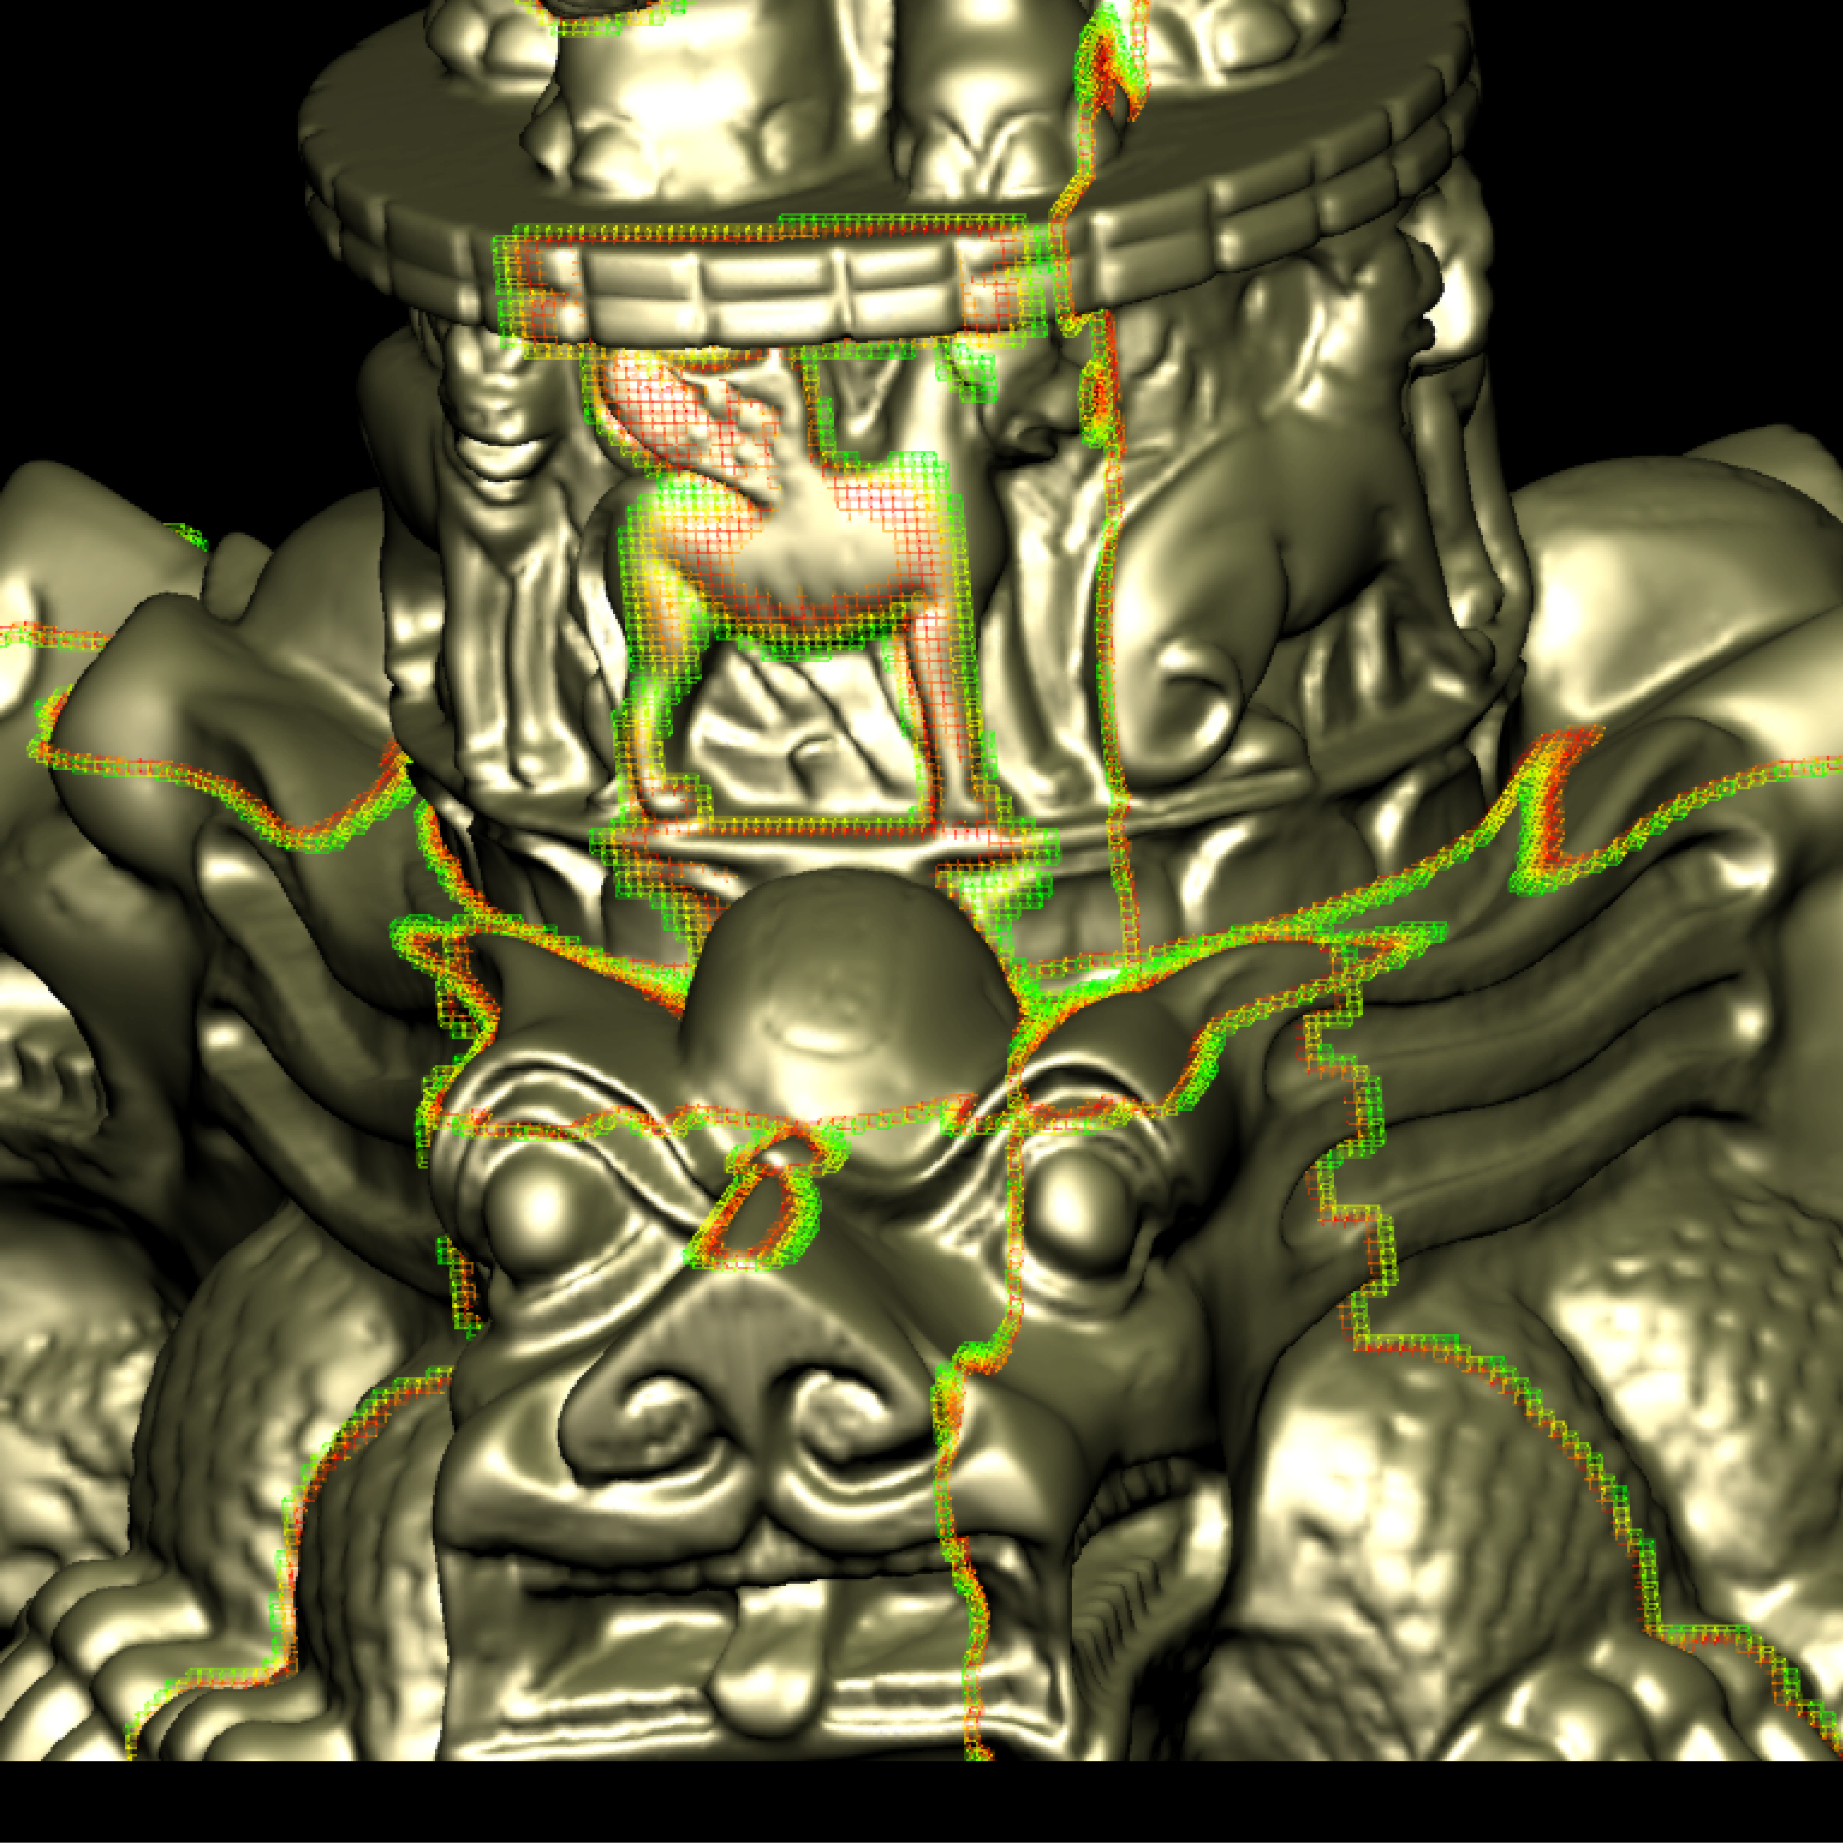
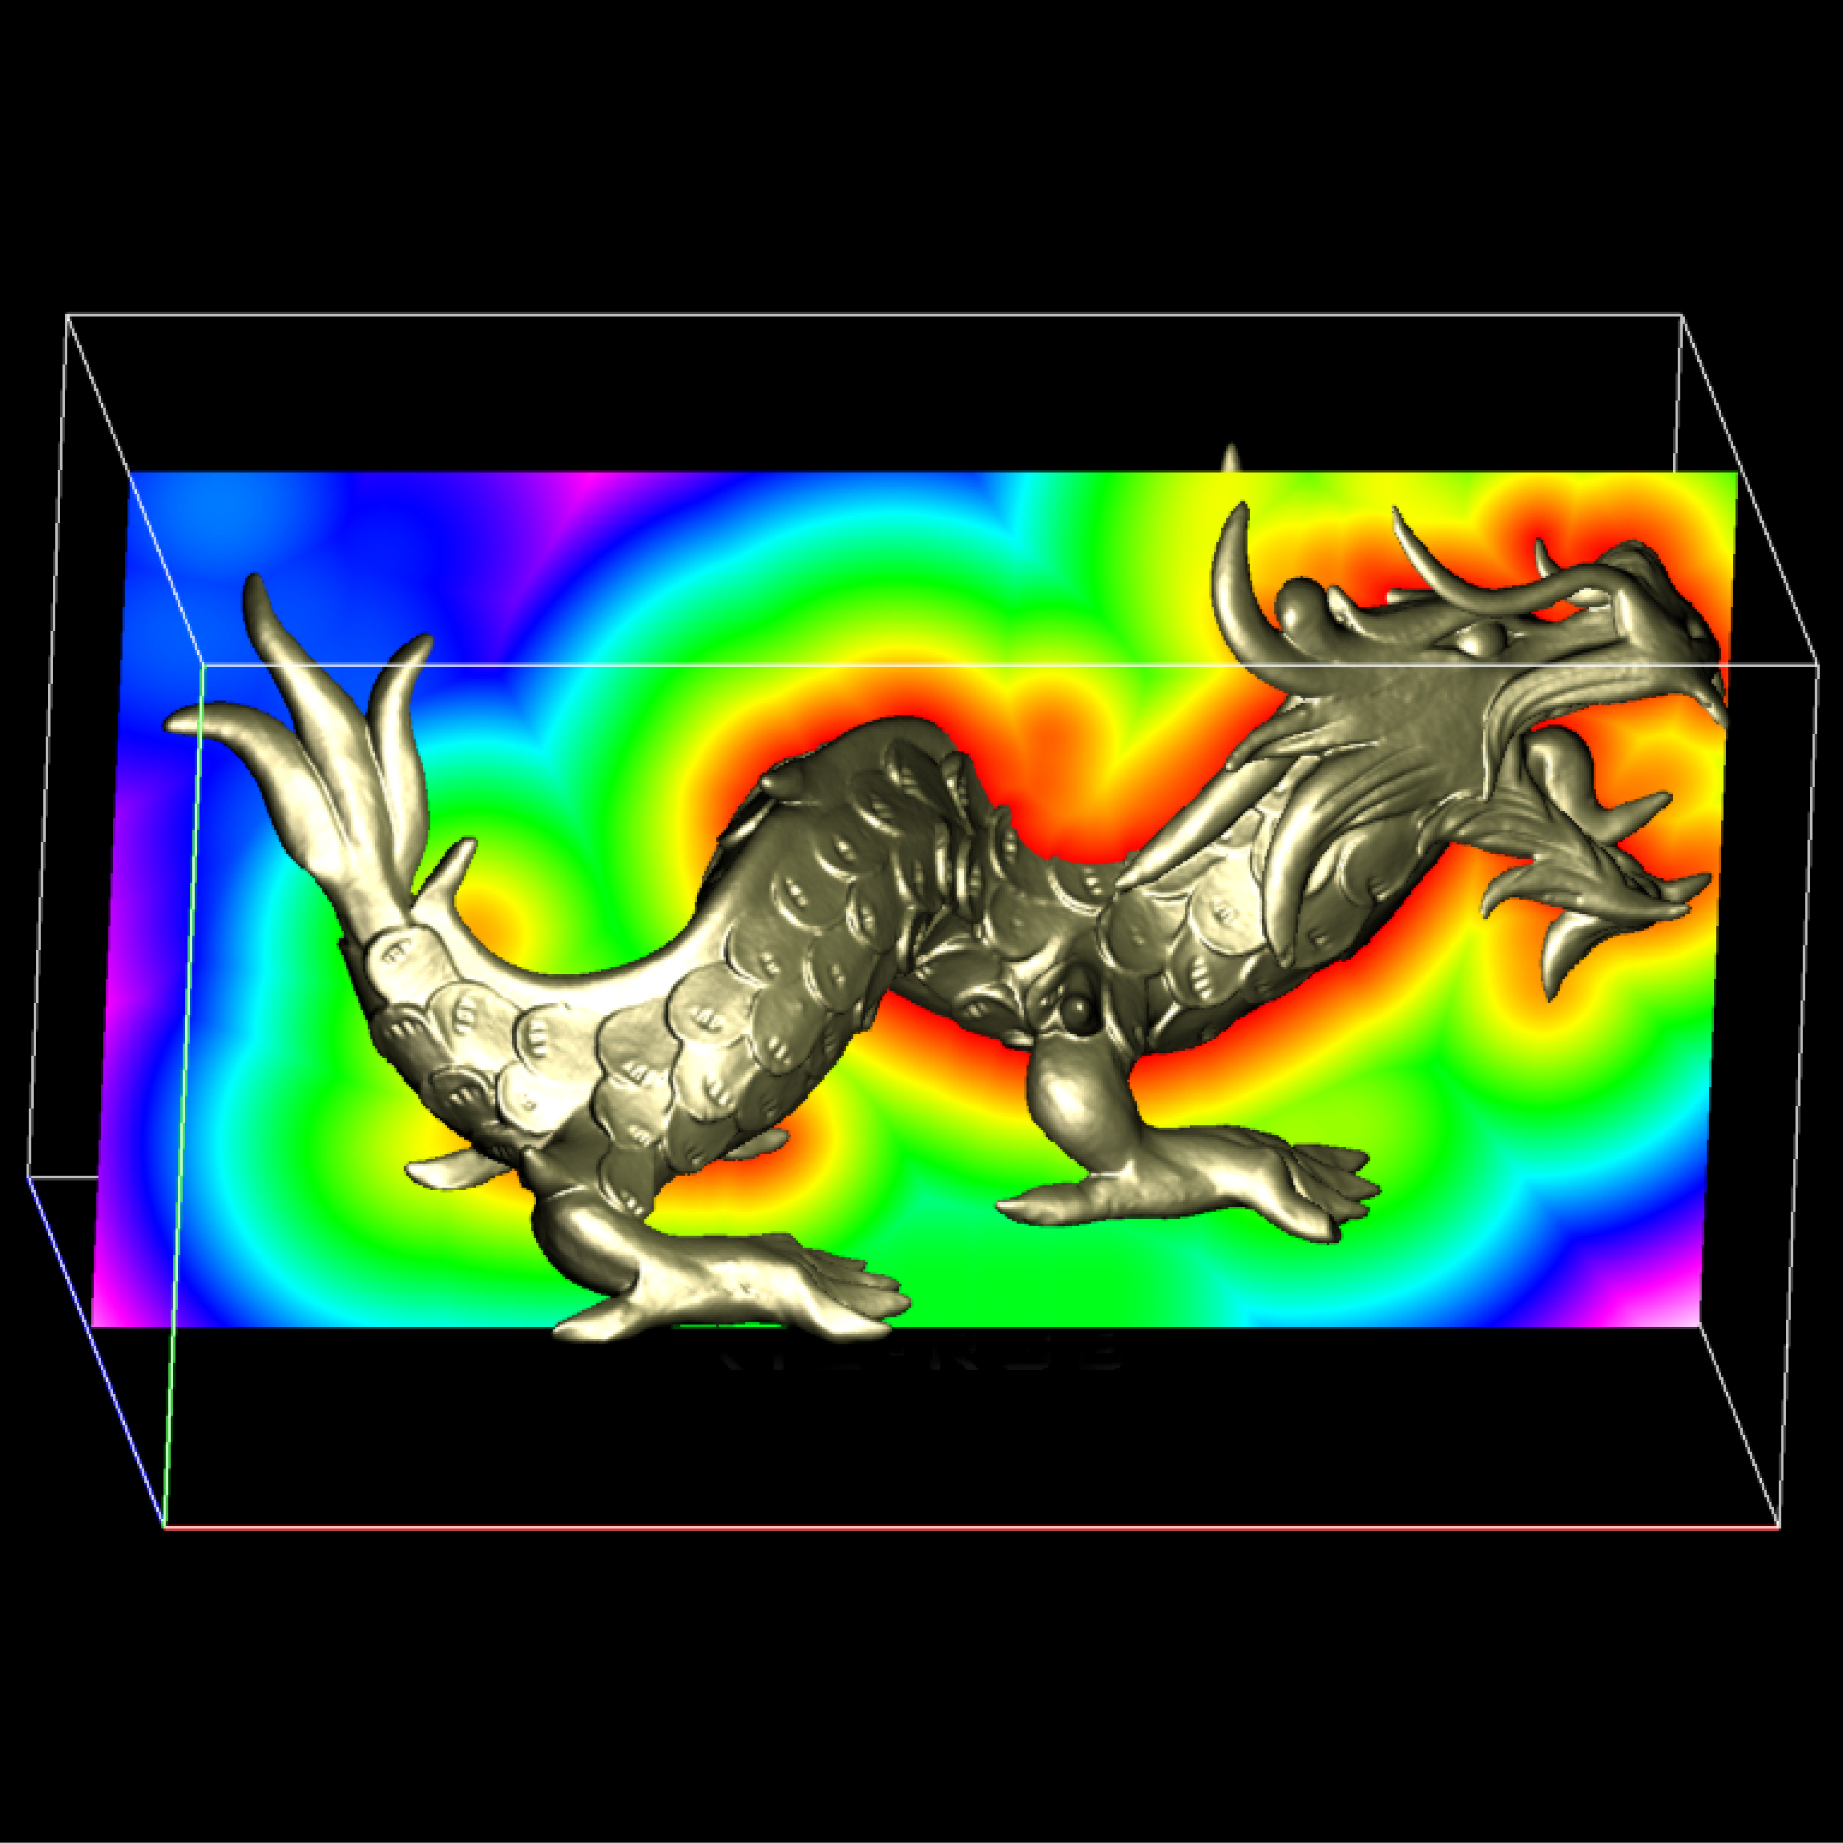
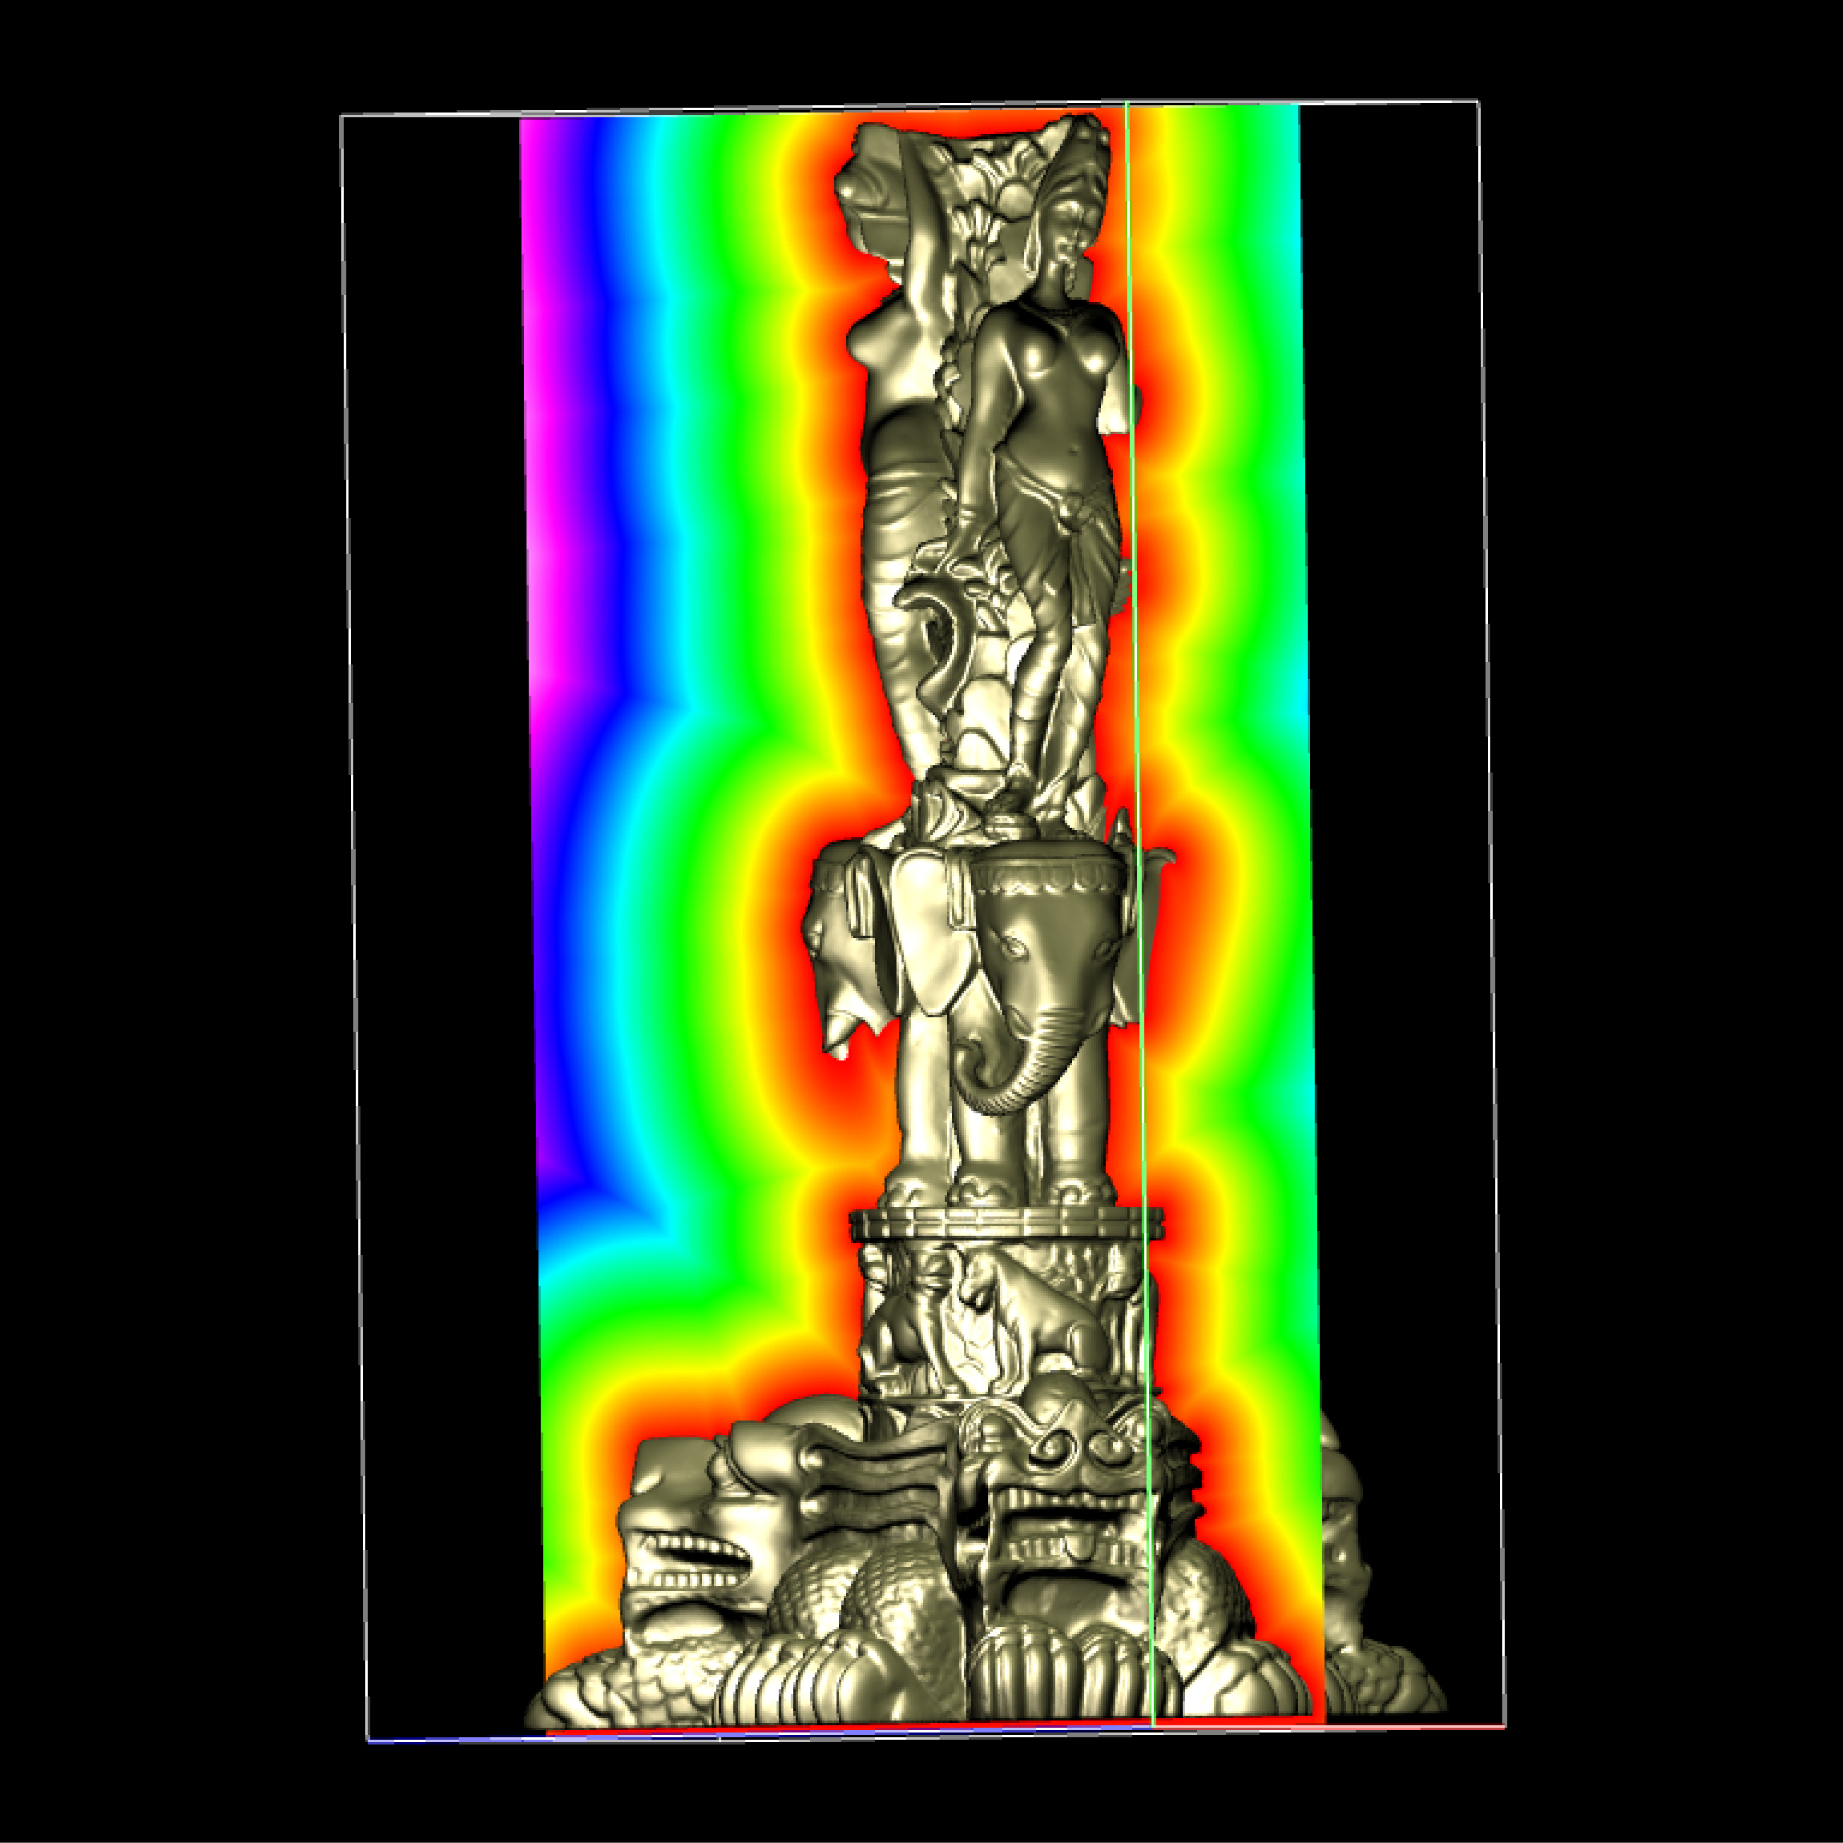
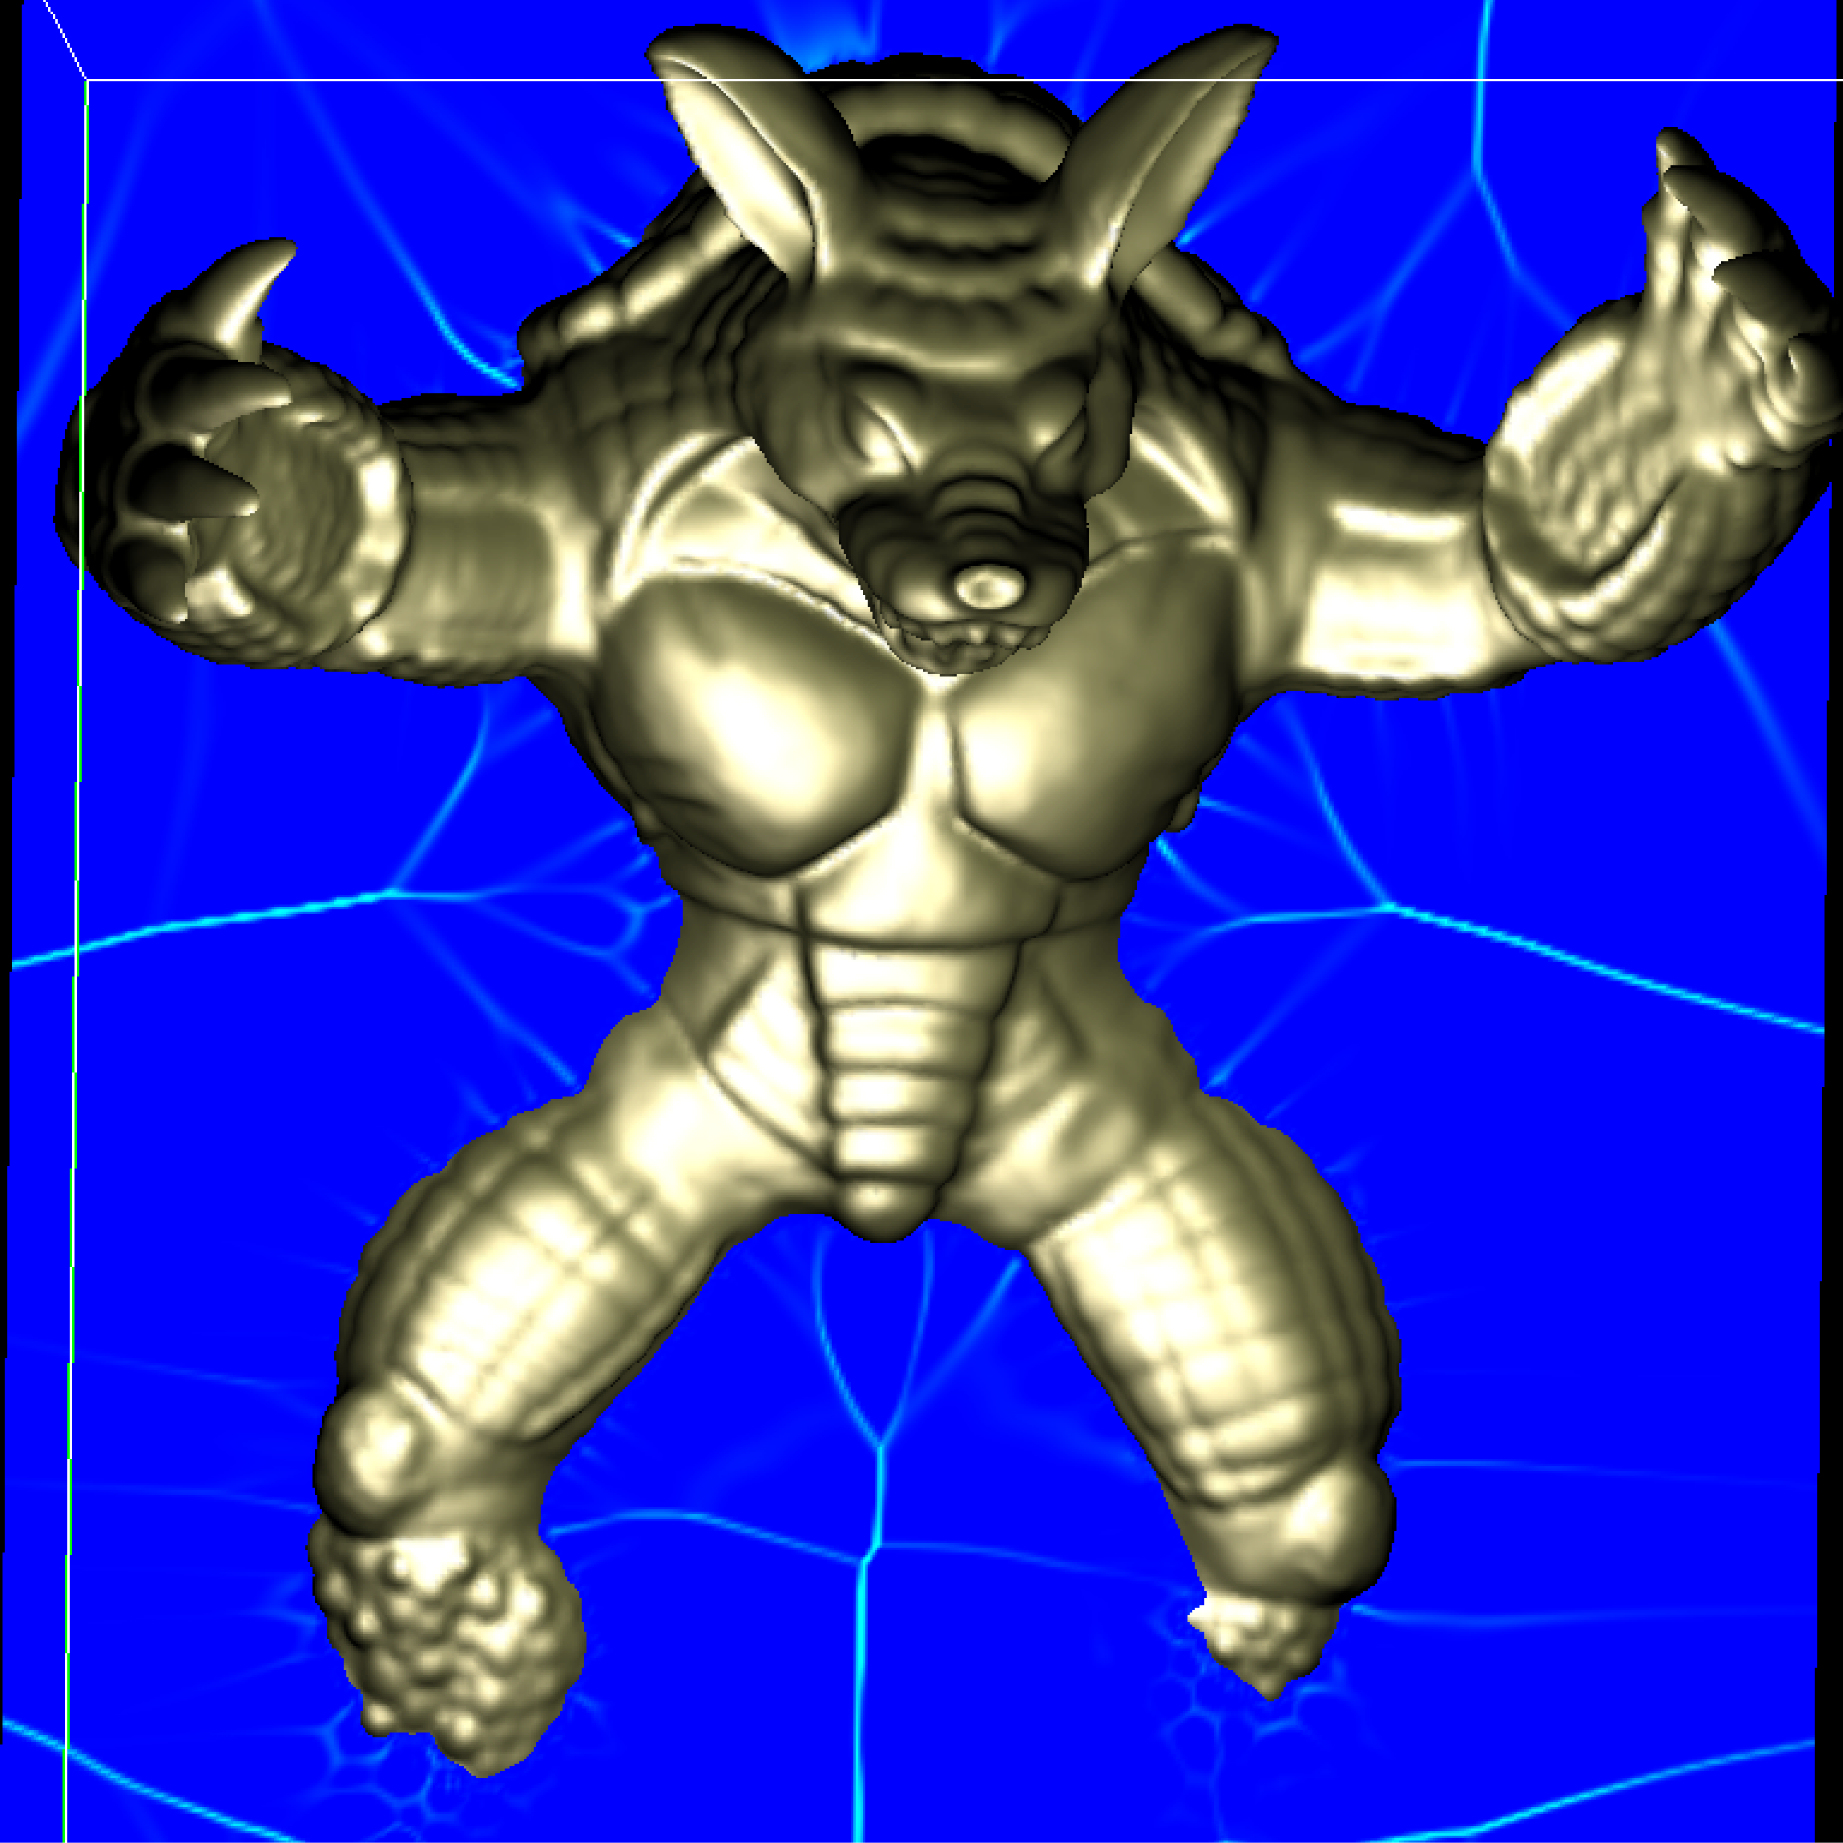
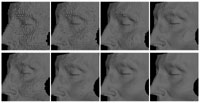
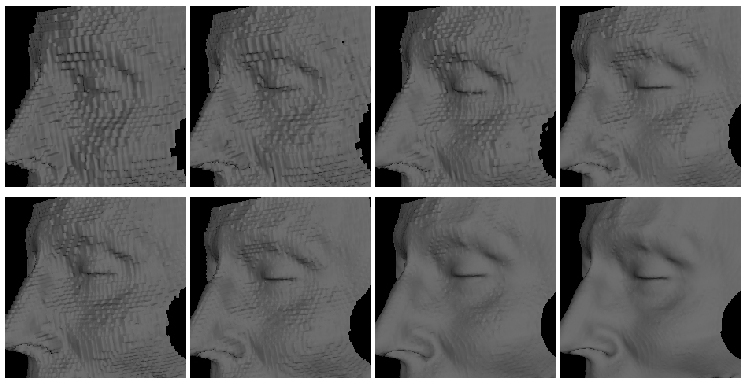
The signed distance field for a polygonal model is a useful representation that facilitates efficient computation in many visualization and geometric processing tasks. Often it is more effective to build a local distance field only within a narrow band around the surface that holds local geometric information for the model. In this paper, we present a novel technique to construct a volumetric local signed distance field of a polygonal model. To compute the local field efficiently, exactly those cells that cross the polygonal surface are found first through a new voxelization method, building a list of intersecting triangles for each boundary cell. After their neighboring cells are classified, the triangle lists are exploited to compute the local signed distance field with minimized voxel-to-triangle distance computations. While several efficient methods for computing the distance field, particularly those harnessing the graphics processing unit's (GPU's) processing power, have recently been proposed, we focus on a CPU-based technique, intended to deal flexibly with large polygonal models and high-resolution grids that are often too bulky for GPU computation.
- B. Chang, D. Cha, and I. Ihm, "Computing Local Signed Distance Fields for Large Polygonal Models," Computer Graphics Forum (EuroVis 2008: Eurographics/IEEE Symposium on Visualization), Vol. 27, No. 3, pp. 799-806, May 2008.
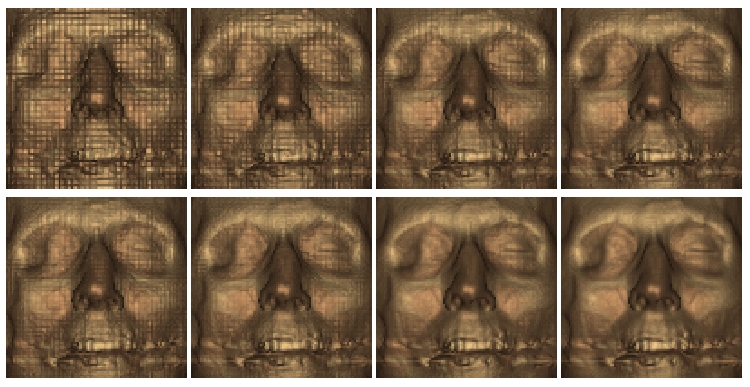
- Voxelization results.
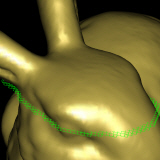 (a) From our method: successfully located exactly those cells that intersect the polygonal model
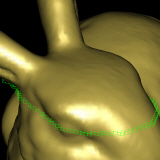 (b) From a traditional scan-conversion method
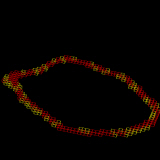 (c) Missing cells in (b) in yellows
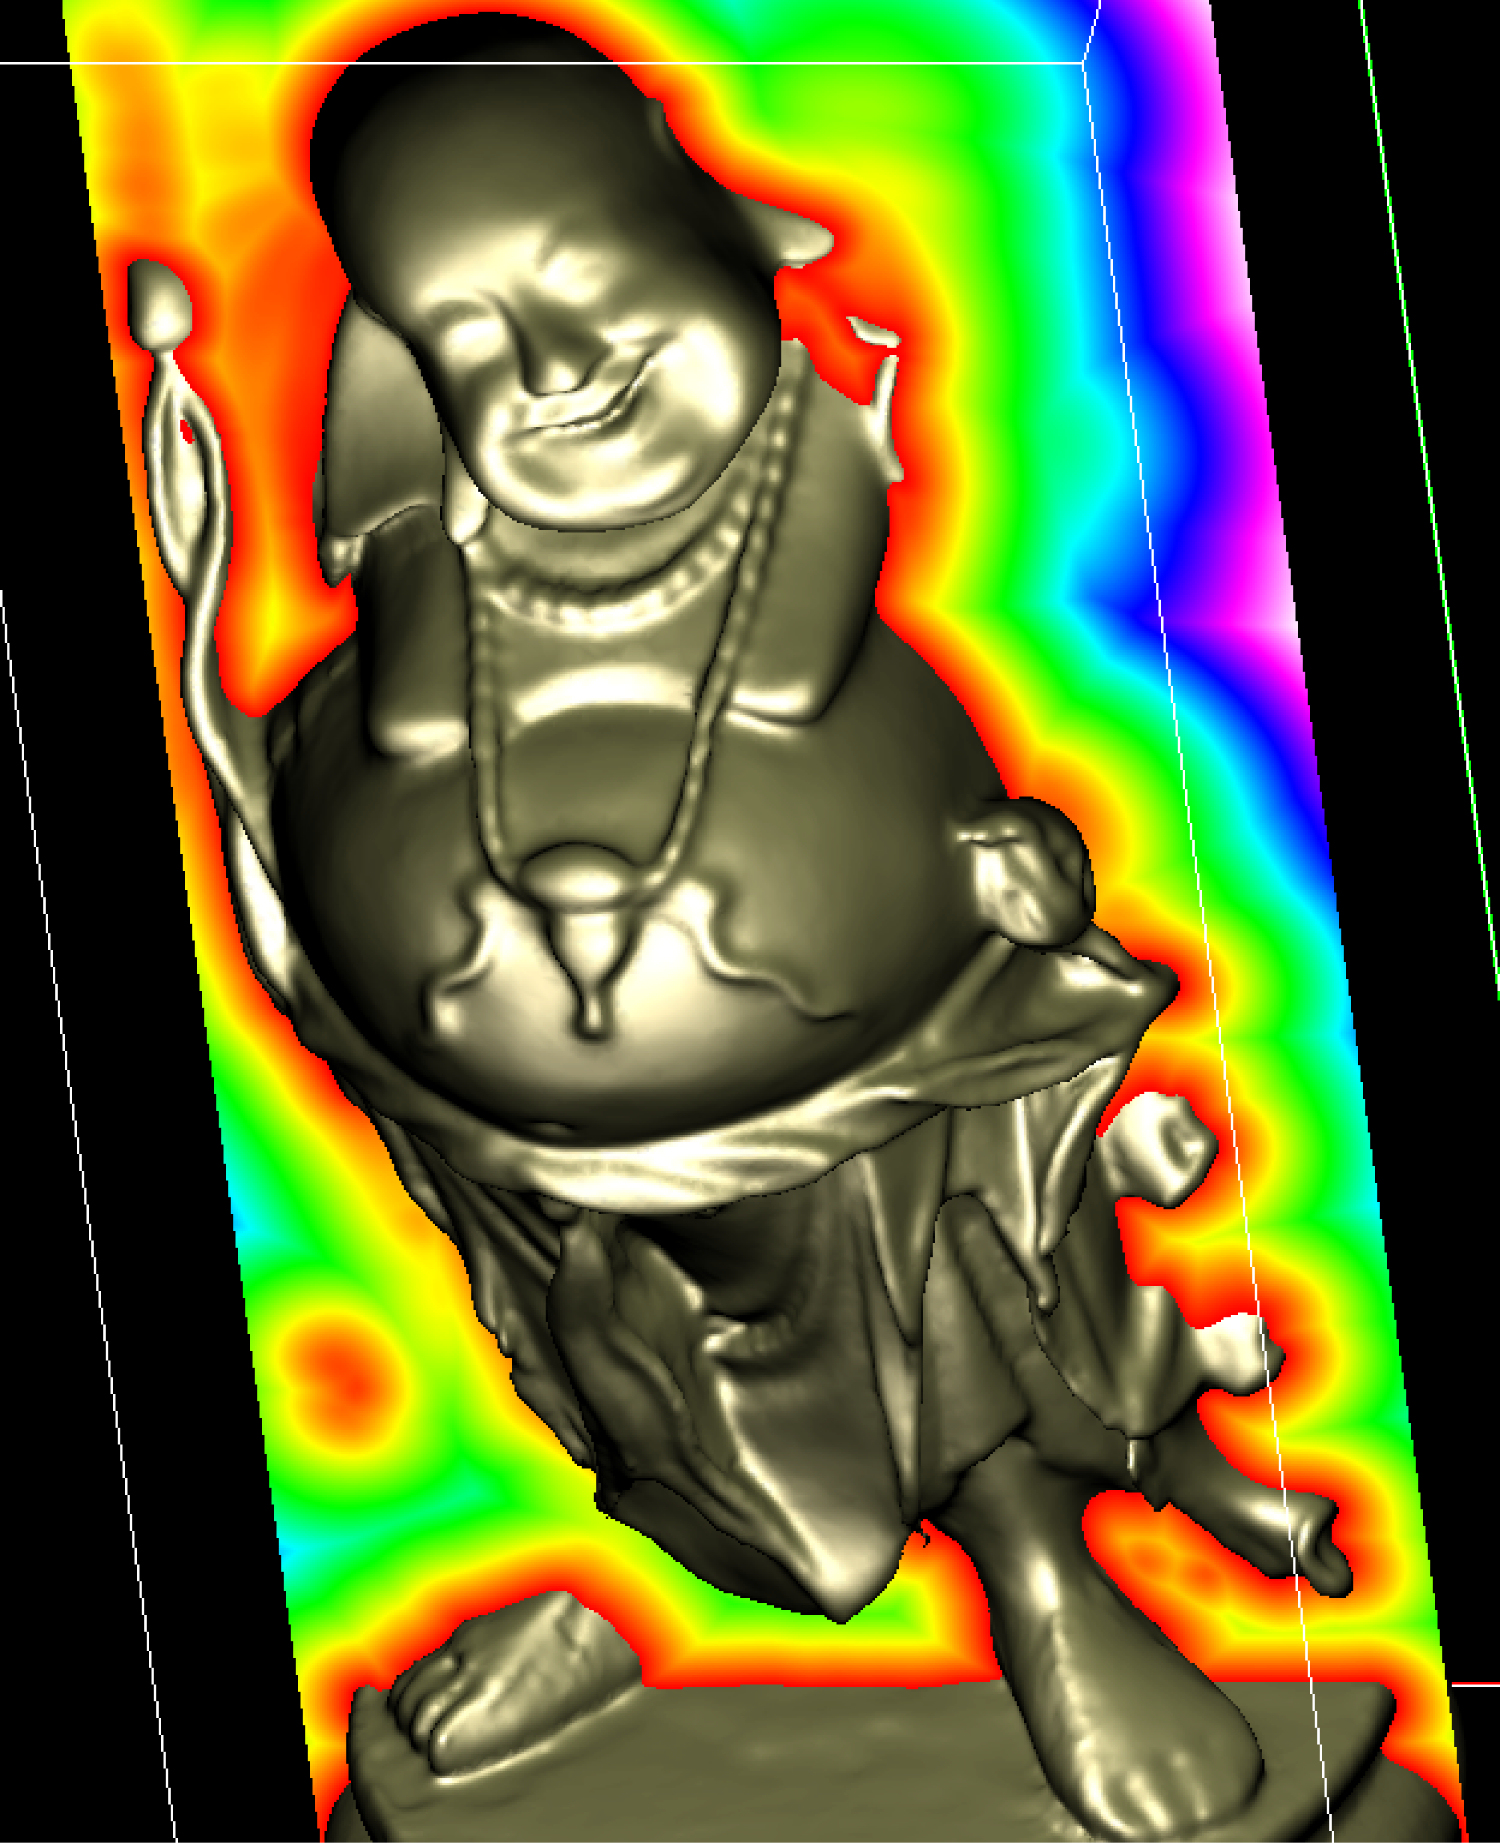
 - Local signed distance field.
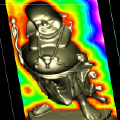
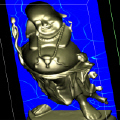
 (a) Happy Buddha
(# of polygons
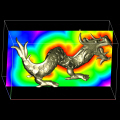
= 1,087,716)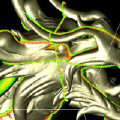 (b) Asian Dragon
(# of polygons
= 7,218,906)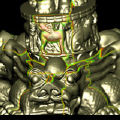 (c) Thai Statue
(# of polygons
= 10,000,000)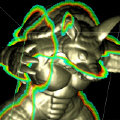 (d) Armadillo
(# of polygons
= 345,944) - Global signed distance field.
 (a) Happy Buddha
(# of polygons
= 1,087,716)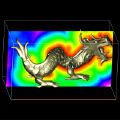 (b) Asian Dragon
(# of polygons
= 7,218,906)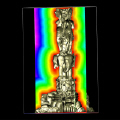 (c) Thai Statue
(# of polygons
= 10,000,000)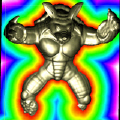 (d) Armadillo
(# of polygons
= 345,944) - Gradient field.
 (a) Happy Buddha
(# of polygons
= 1,087,716) (b) Asian Dragon
(# of polygons
= 7,218,906)
(c) Thai Statue
(# of polygons
= 10,000,000)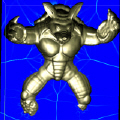 (d) Armadillo
(# of polygons
= 345,944) - Happy Buddha (# of polygons = 1,087,716). [HappyBuddha.avi]
- Asian Dragon (# of polygons = 7,218,906). [AsianDragon.avi]
- Thai Statue (# of polygons = 10,000,000). [ThaiStatue.avi]
- Membrane (# of polygons = 29,622). [Membrain.avi]
- Armadillo (# of polygons = 345,944). [Armadillo.avi]
- Dragon (# of polygons = 871,414). [Dragon.avi]


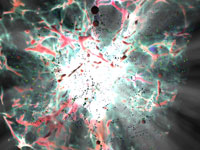
Cosmological reionization occured when the first star and quasar light propagated into the intergalactic medium and ionized the neutral gas comprised mostly of hydrogen and helium. The study of cosmological reionization is intimately related to the fundamental problems of galaxy and star formation. Astronomers have recently detected light from galaxies and quasars emitted almost 13 billion years ago, cosmologically red-shifted by the fractional amount z = 6, which means it left those sources less than a billion years after the Big Bang. In this scientific animation, we visualize the computational results, produced by Galaxy Formation and the Intergalactic Medium Research Group of University of Texas at Austin, for the propagation of a cosmological ionization front around a massive starburst at a red-shift z = 9. Here, the ionization front emanating from the central source is shown by a white transparent surface, and clears away neutral gas as it propagates outward. Note how the ionization front has ionized nearly the entire box, except for regions behind high density gas in halos. The movies were created using our photon mapping-based Monte Carlo ray tracer. The first clip was made through a simple volume rendering. A light emission effect was created in the second one by emitting photons through the participating media. In the third one, a flash of light was added by instantly emitting photons outward to depict an intense highlight effect.
- A snapshot.

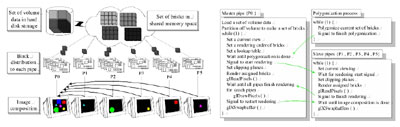
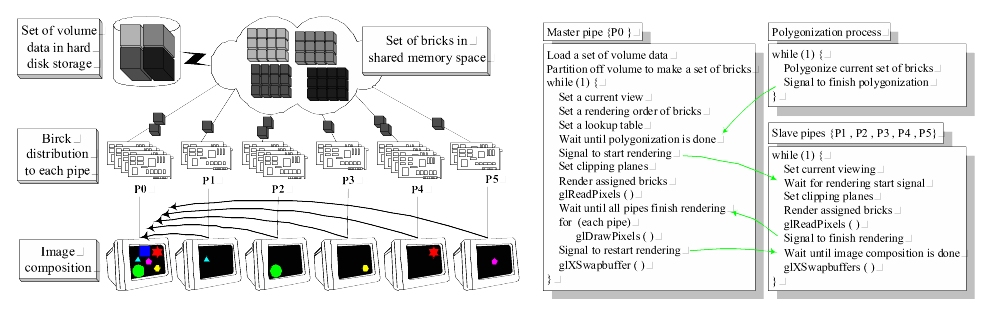
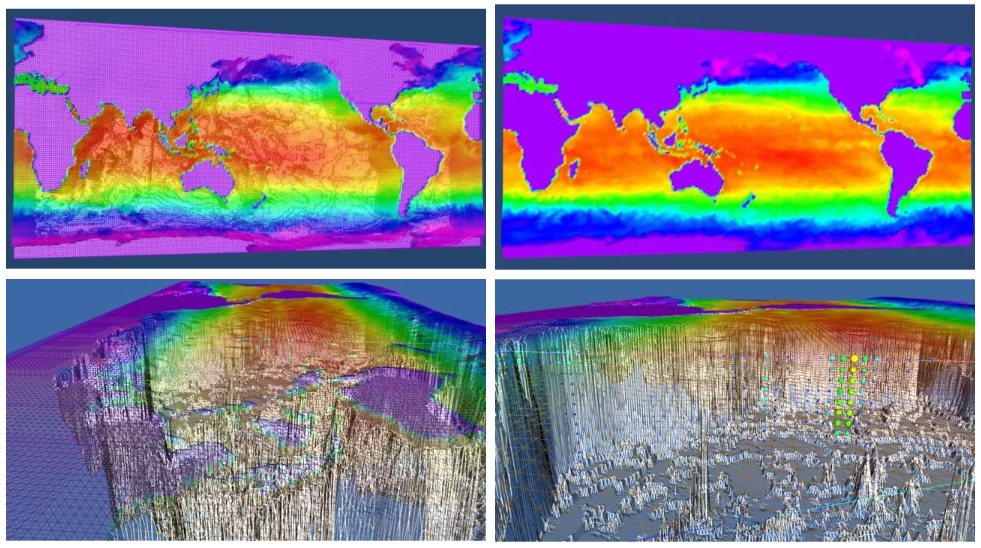
This paper presents two visualization techniques suitable for huge oceanography time-varying volume datasets on high-performance graphics workstations. We first propose an off-line parallel rendering algorithm that merges volume ray-casting and on-the-fly isocontouring. This hybrid technique is quite effective in producing fly-through movies of high resolution. We also describe an interactive rendering algorithm that exploits multi-piped graphics hardware. Through this technique, it is possible to achieve interactive-time frame rates for huge time-varying volume data streams. While both techniques have been originally developed on an SGI visualization system, they can be also ported to commodity PC cluster environments with great ease.
- S. Park, C. Bajaj, and I. Ihm, "Visualization of Very Large Oceanography Time-Varying Volume Datasets", ICCS 2004 (LNCS 3037), pp. 419-426, Krakow, Poland, June 2004.
- The visualization system architecture.
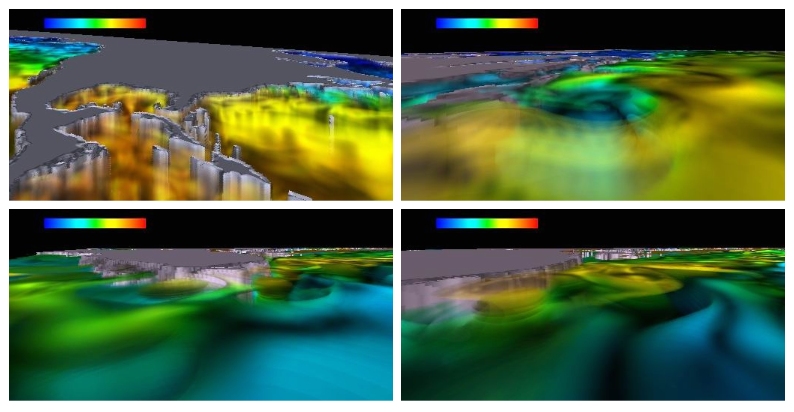
- Images of T data created by combining volume rendering and iso-surfacing.
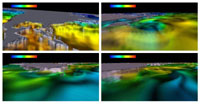
- A fly-through under the ocean.

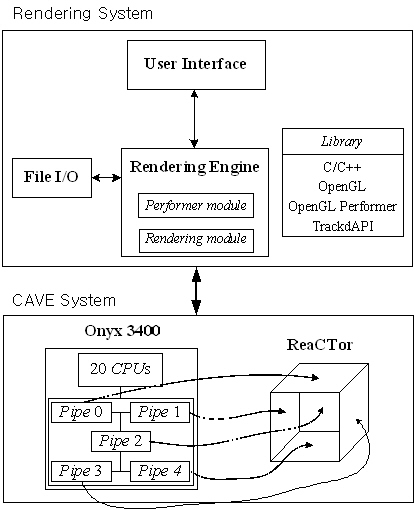
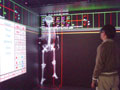
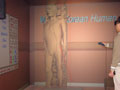
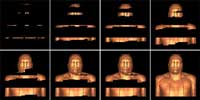
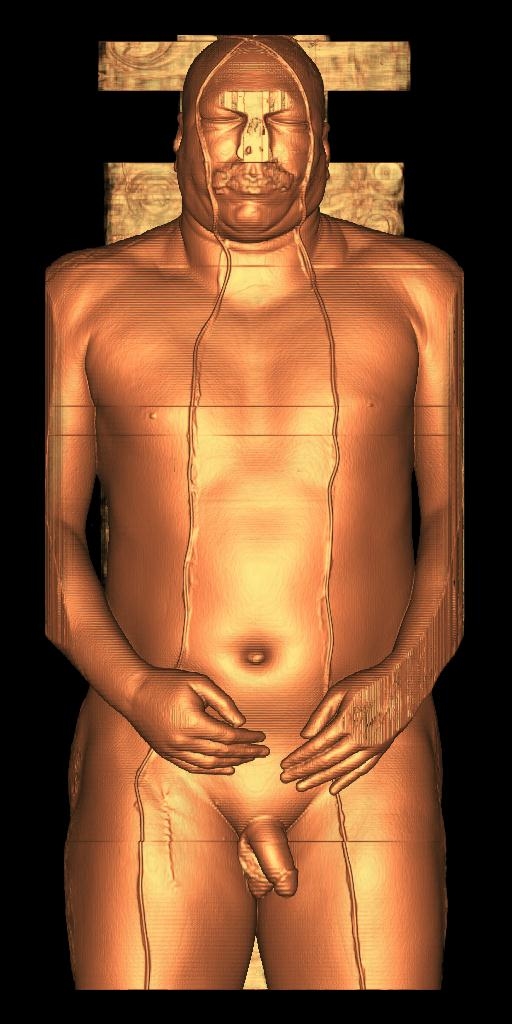
We have developed an interactive visualization software for an immersive 3D virtual environment system, which generates stereoscopic images from huge human volume datasets in real-time using an improved volume visualization technique. Our software utilizes a CAVE system to reconstruct such huge volume datasets as the Visible Human and the Visible Korean Human, produced by NLM and KISTI, respectively. In stead of using the isosurfacing and 3D texture-mapping based volume rendering methods that easily slow down as data sizes increase, our system exploits a new image-based rendering technique to guarantee the effective interactive visualization.
- I. Ihm, B. Lee, J.-Y. Lee, M. Joh, and S. Park, "Interactive Stereoscopic Visualization of Very Large Visible Men on CAVE", ICCSA 2003 (LNCS 2667), pp. 41-50, Montreal, Canada, May 2003.
- M. Im, J. Lee, H. Park, M. Joh, M. Chung, and I. Ihm, "Real-Time Stereoscopic Visualization of Visible Korean Human (VKH) Dataset on CAVE," The 6th Korea-Germany Joint Workshop on Advanced Medical Image Processing, pp. 140-147, Heidelberg, Germany, June 2002.
- The visualization system architecture.
- Snapshots of stereoscopic visualization in the SeeMore system.

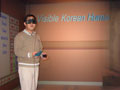


- Korea Institute of Science and Technology Information (KISTI)
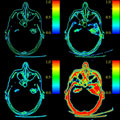
When interactive real-time applications are developed with very large volume data, the use of lossy compression is often inevitable. Lossy compression schemes generally encode data without consideration of the purpose of visualization that is actually performed, which often results in inefficient compression. In this paper, we present a new method for classifying voxels according to their importance in visualization, and assigning appropriate weights to them. The associated weight information can be combined with lossy compression schemes to reduce the visual degradation of reconstructed images, resulting in higher compression rates and visual fidelity. Test results demonstrate that the proposed technique improves both the amount of compression and the quality of visualization significantly.
- C. Bajaj, I. Ihm, and S. Park, "Visualization-Specific Compression of Large Volume Data", Pacific Graphics 2001, pp. 212-222, Tokyo, Japan, October 2001.
- Comparison of isosurface-rendered images:
 (top) unweighed 2%, 3%, 5%, 7% (bottom) weighed 2%, 3%, 5%, 7%.
 - Comparison of ray-cast images:
 (top) unweighed 2%, 3%, 5%, 7% (bottom) weighed 2%, 3%, 5%, 7%
 - Ray-cast images and color-mapped weight images for sample slices:
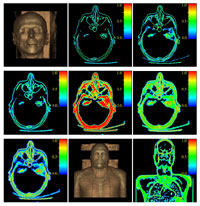 (a) Rendering from uncompressed bighead data, (b)
 : slice max = 6, (c)
  : slice max = 0.642 (d)
  : slice max = 23, (e)
  : slice max = 32, (f)
  : maximum weight (g) : summed weight, (h) Rendering from uncompressed Visible Man data, (i) : maximum weight.
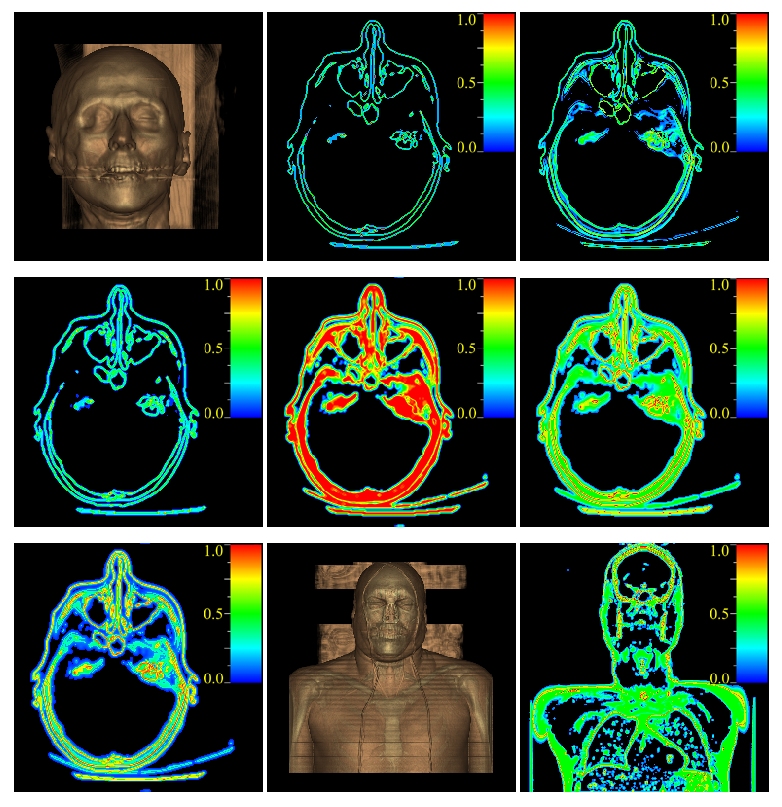
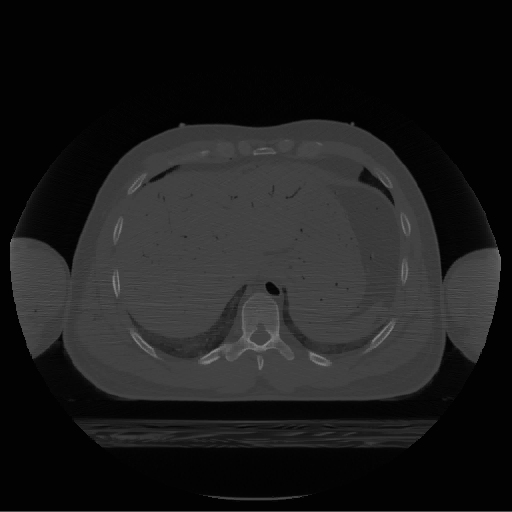
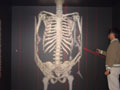
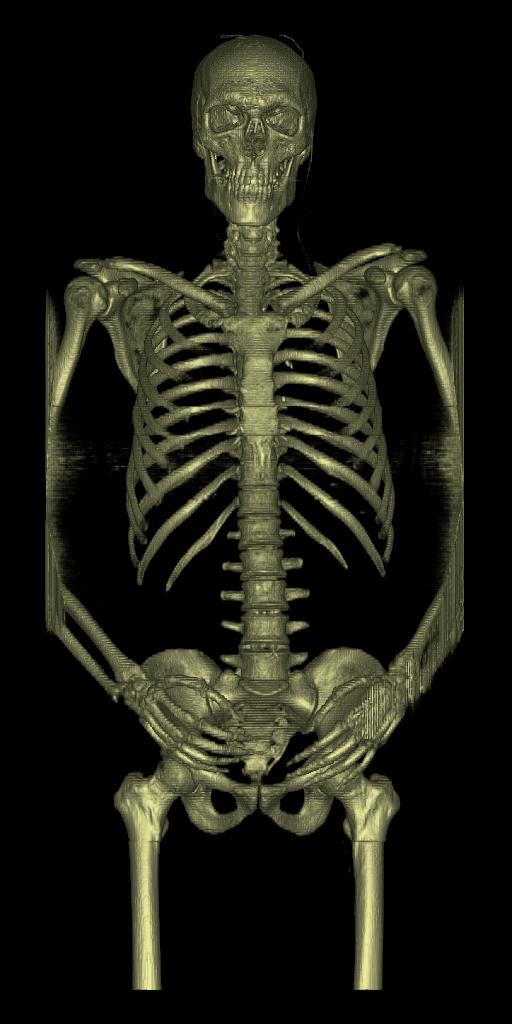
This paper proposes a new parallel ray-casting scheme for very large volume data on distributed-memory architectures. Our meth\-od, based on data compression, attempts to enhance the speedup of parallel rendering by quickly reconstructing data from local memory rather than expensively fetching them from remote memory spaces. Furthermore, it takes the advantages of both object-order and image-order traversal algorithms: It exploits object-space and image-space coherence, respectively, by traversing a min-max octree block-wise and using a run-time quadtree which is maintained dynamically against pixels' opacity values. Our compression-based parallel volume rendering scheme minimizes communications between processing elements during rendering, hence is also very appropriate for more practical distributed systems, such as clusters of PCs and/or workstations, in which data communications between processors are regarded as quite costly. We report experimental results on a Cray T3E for the Visible Man dataset.
- C. Bajaj, I. Ihm, G. Koo, and S. Park, "Parallel Ray Casting of Visible Human on Distributed Memory Architectures", VisSym '99: Joint EUROGRAPHICS - IEEE TCVG Symposium on Visualization, pp.269-276, Vienna, Austria, May 1999.
- Parallel ray-cast Visible Man:
 skin
skin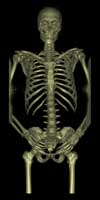 bone
bone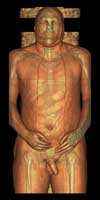 transparent skin
 - Parallel ray casting

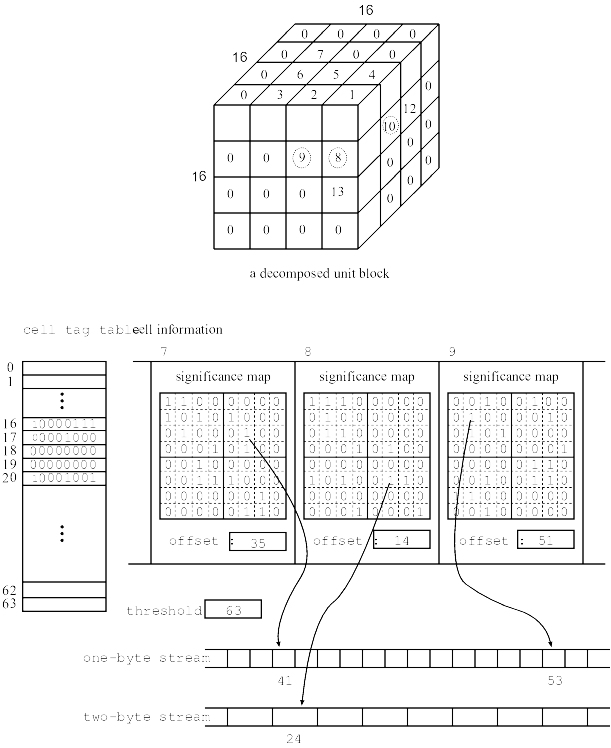
Interactive visualization of very large volume data has been recognized as a task requiring great effort in a variety of science and engineering fields. In particular, such data usually places considerable demands on run-time memory space. In this paper, we present an effective 3D compression scheme for interactive visualization of very large volume data, that exploits the power of wavelet theory. In designing our method, we have compromised between two important factors: high compression ratio and fast run-time random access ability. Our experimental results on the Visual Human data sets show that our method achieves fairly good compression ratios. In addition, it minimizes the overhead caused during run-time reconstruction of voxel values. This 3D compression scheme will be useful in developing many interactive visualization systems for huge volume data, especially when they are based on personal computers or workstations with limited memory.
- I. Ihm, and S. Park, "Wavelet-Based 3D Compression Scheme for Interactive Visualization of Very Large Volume Data", Computer Graphics Forum, Vol. 18, No. 1, pp. 3-15, March 1999.
- I. Ihm, and S. Park, "Wavelet-Based 3D Compression Scheme for Very Large Volume Data", Graphics Interface '98, pp.107-116, Vancouver, Canada, June 1998.
- Wavelets encoding scheme.
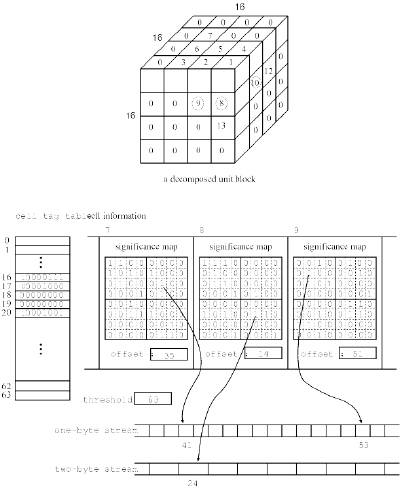
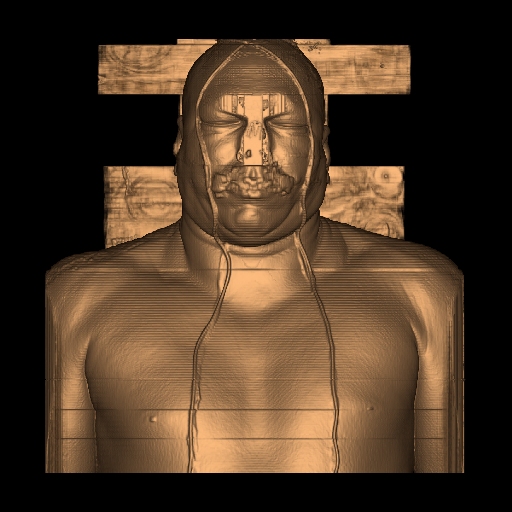
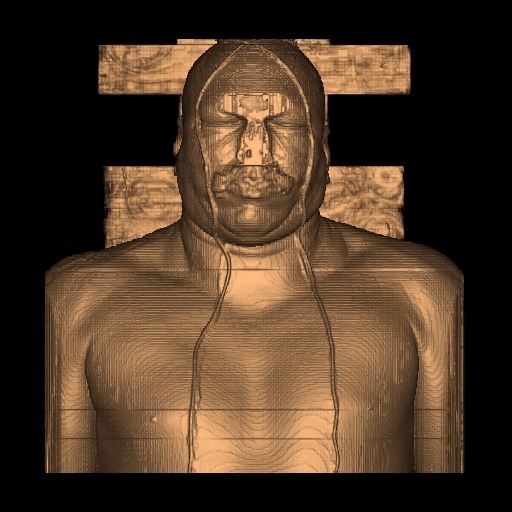
- Slices of the Visible Man:
[ON:Octree Only, OQ:Octree + Quadtree, OP:Orthographic Proj., PP: Perspective Proj.]


- The ray-cast Visible Man (upper body - skin):